
Evidence you can act on
From raw data to a deck that keeps answering, in five deliberate moves.
Two headline capabilities on one workbench: AI-assisted analysis and end-to-end report automation. The first deck is built for you, unattended, and every re-run rebuilds to your standard whether the change is a new wave, a new market or a new client. Statistics run on a versioned, test-covered engine, and every number traces back to the source table, test, weight, computation and verbatim behind it.
Import & verify
Get clean, trustworthy data into the workbench before a single chart is drawn.
1.1 · Import & verify
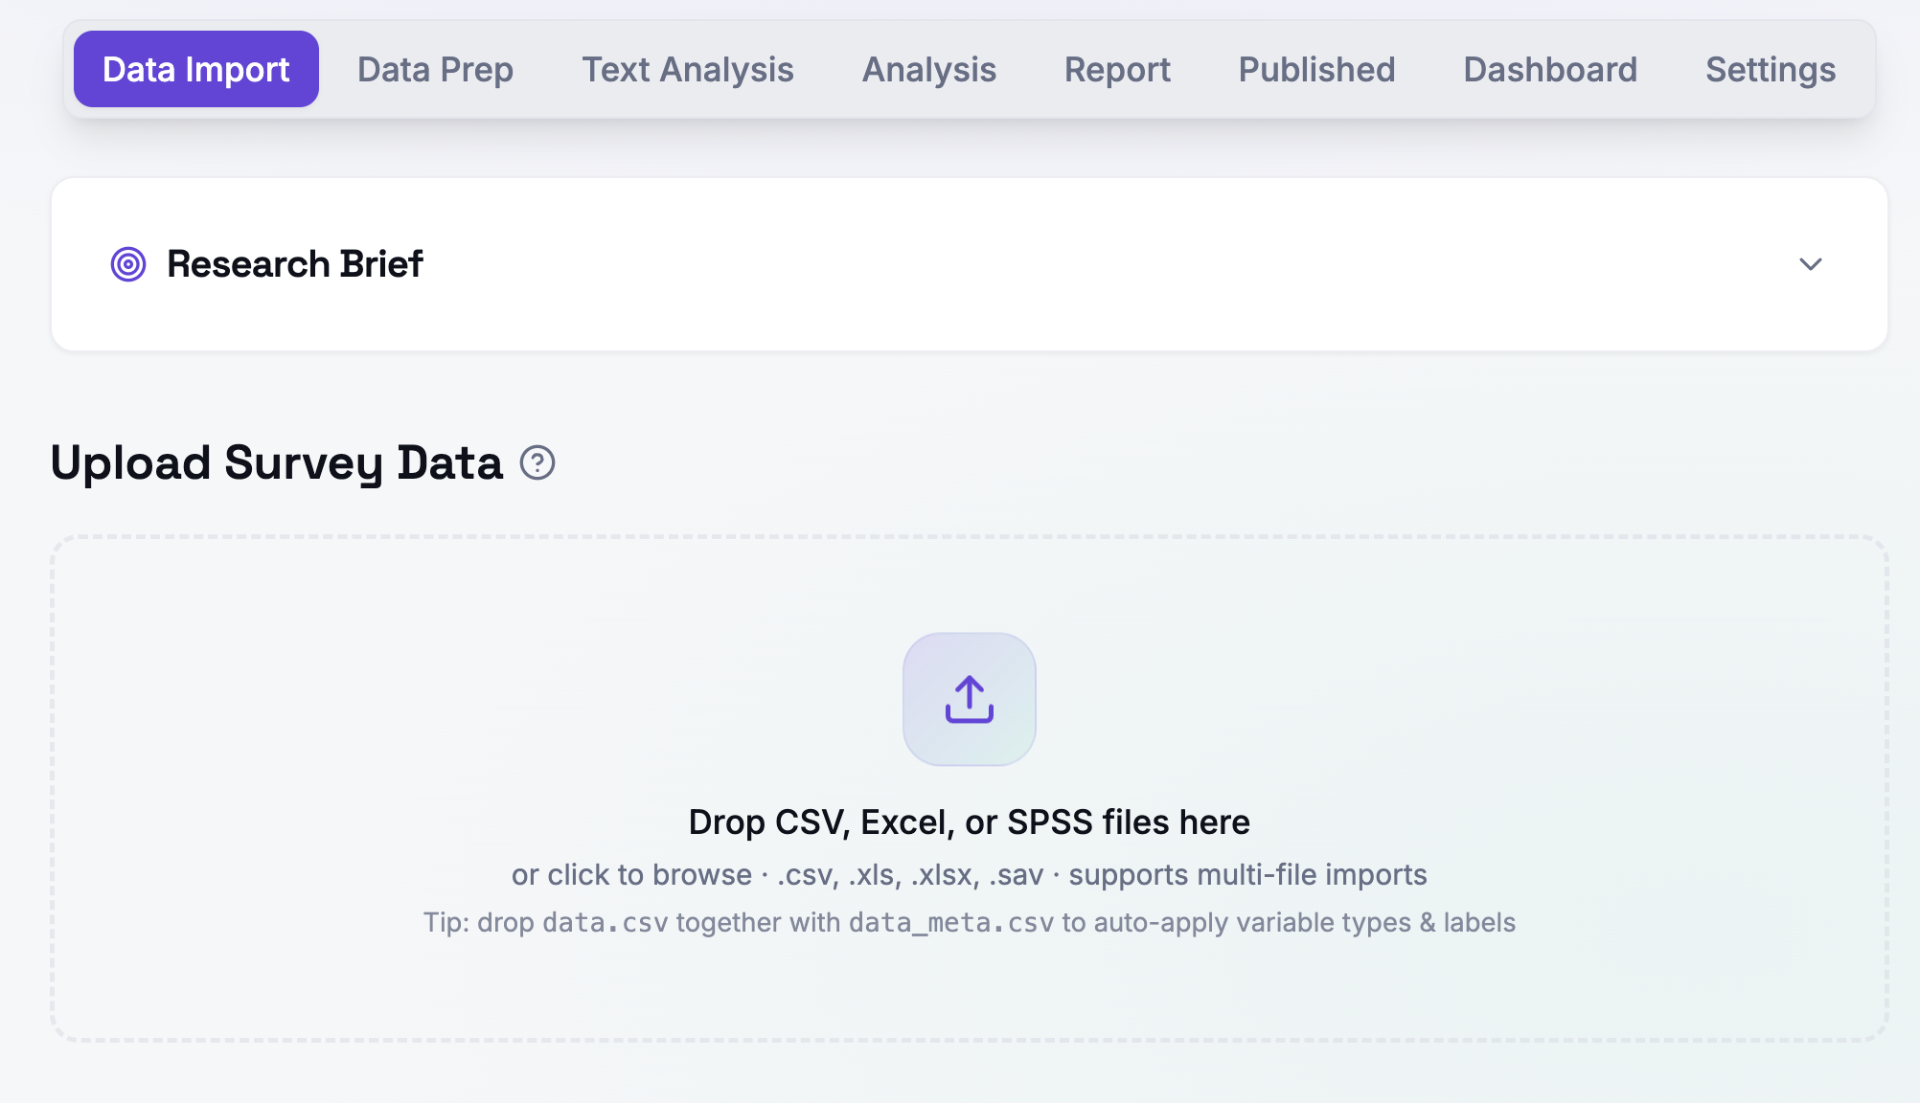
Smart import & health wizard
Multi-file SPSS, CSV and Excel ingestion. We auto-detect types, missing-data patterns and suspicious response strings, then walk you through a verification wizard before analysis runs.
- Native .sav, .csv, .xlsx with metadata sidecar
- Multi-file merge with auto key-detection
- Missing-data, straight-lining, speeder flags
- Variable-label and value-label QA
post-import_health.aa
| Variable | Type | Health |
|---|---|---|
| respondent_id | ID | |
| age | Numeric | |
| gender | Categorical | |
| nps_q1 | Scale 0-10 | |
| comments_open | Open-end | |
| purchase_freq | Categorical | |
| channel_pref | Multi-resp |
1.2 · Import & verify
Connected survey platforms (rolling out)
Skip the export-and-upload dance. Direct API integrations sync responses and metadata as fieldwork progresses. Connectors to Qualtrics, Forsta (Decipher / Confirmit), Alchemer, SurveyMonkey, Typeform and Jotform are rolling out; SPSS, CSV and Excel with metadata are live today.
connected_sources.aa
Live today: SPSS, CSV, Excel with metadata.
Analyse with AI
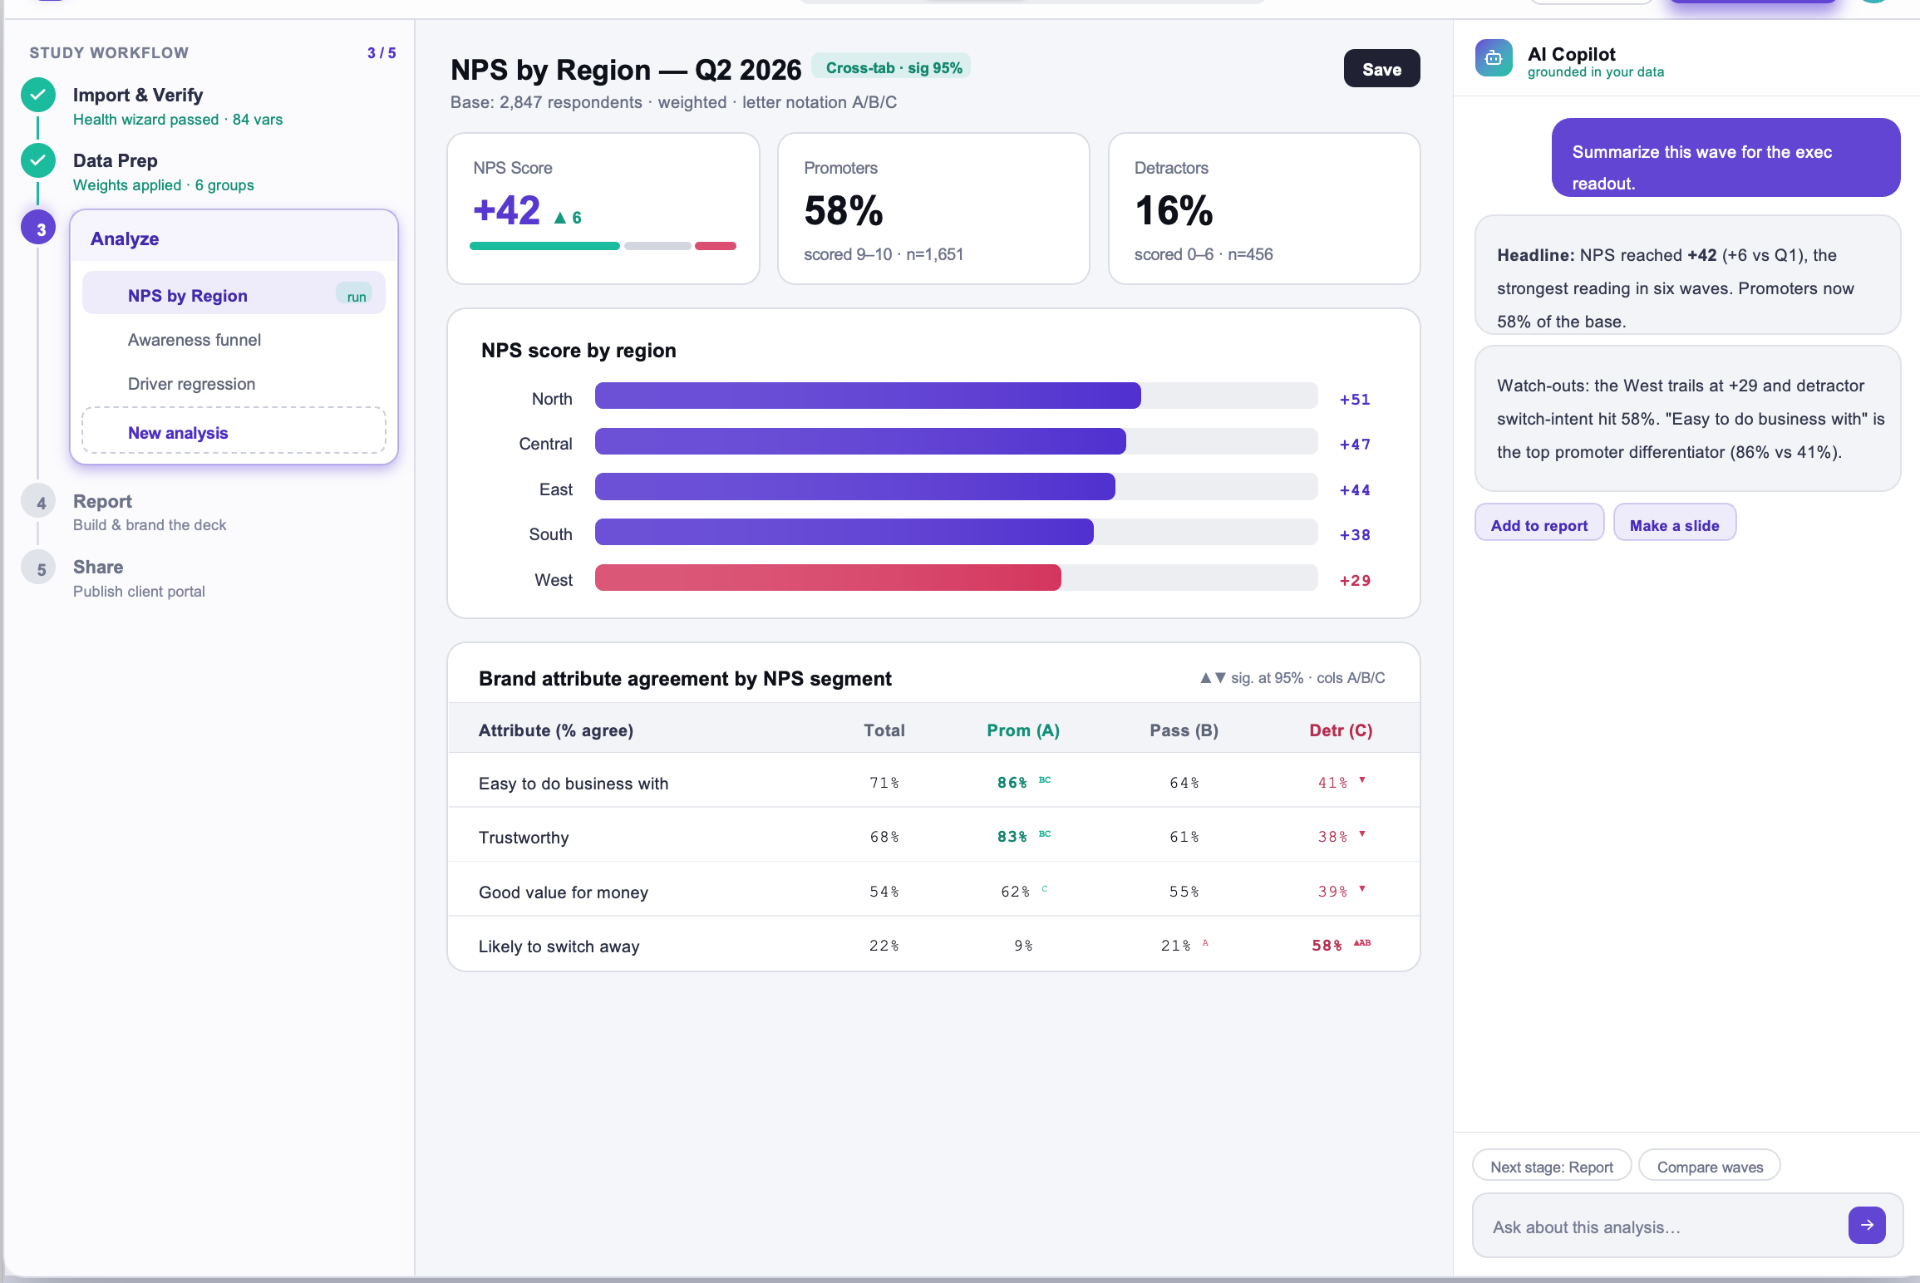
Agents propose the right cuts per section. Take the plan as offered, or build the analysis yourself. The maths runs in tested code; commentary is grounded in your tables, with a full audit trail from claim to cell to computation.
2.1 · Analyse with AI
Auto-analysis planner
A planner proposes the right cuts per section, covering brand, NPS, experience KPIs and open-ends, so analysis starts from a defensible structure rather than a blank canvas.
- Per-section analysis plans
- Analyst-editable, or built from scratch: the plan is only a starting point
- Reusable across projects, waves, markets and clients, unattended
analysis_plan.aa
- BrandSegment splits · Nets
- ExperiencePromoter mix · Top-2-box
- TablesCross-tabs · Sig letters
- Open-endsAuto-themes · Sentiment
2.2 · Analyse with AI
Quantitative analysis suite
Every statistic is computed by fixed, version-controlled code covered by a test suite, never by the language model. The AI decides which tested computation to run; it does not write the maths. Each number is stamped with the exact computation that produced it, so any analyst can re-run it and get the same answer.
- Design-based estimation with Kish effective sample size
- Rim weighting with analyst-set limits
- Significance letters validated by an equivalence test suite
- Every cell traces to its computation and arguments
- Cross-tabs with letter-notation significance testing
- Means, frequencies, top/bottom box, NPS, CSAT
- Segment splits carried through tables, charts and slides
- Matrix batteries, ranking and weighted bases
- Wave comparison for trackers (rolling out)
cross_tab.aa
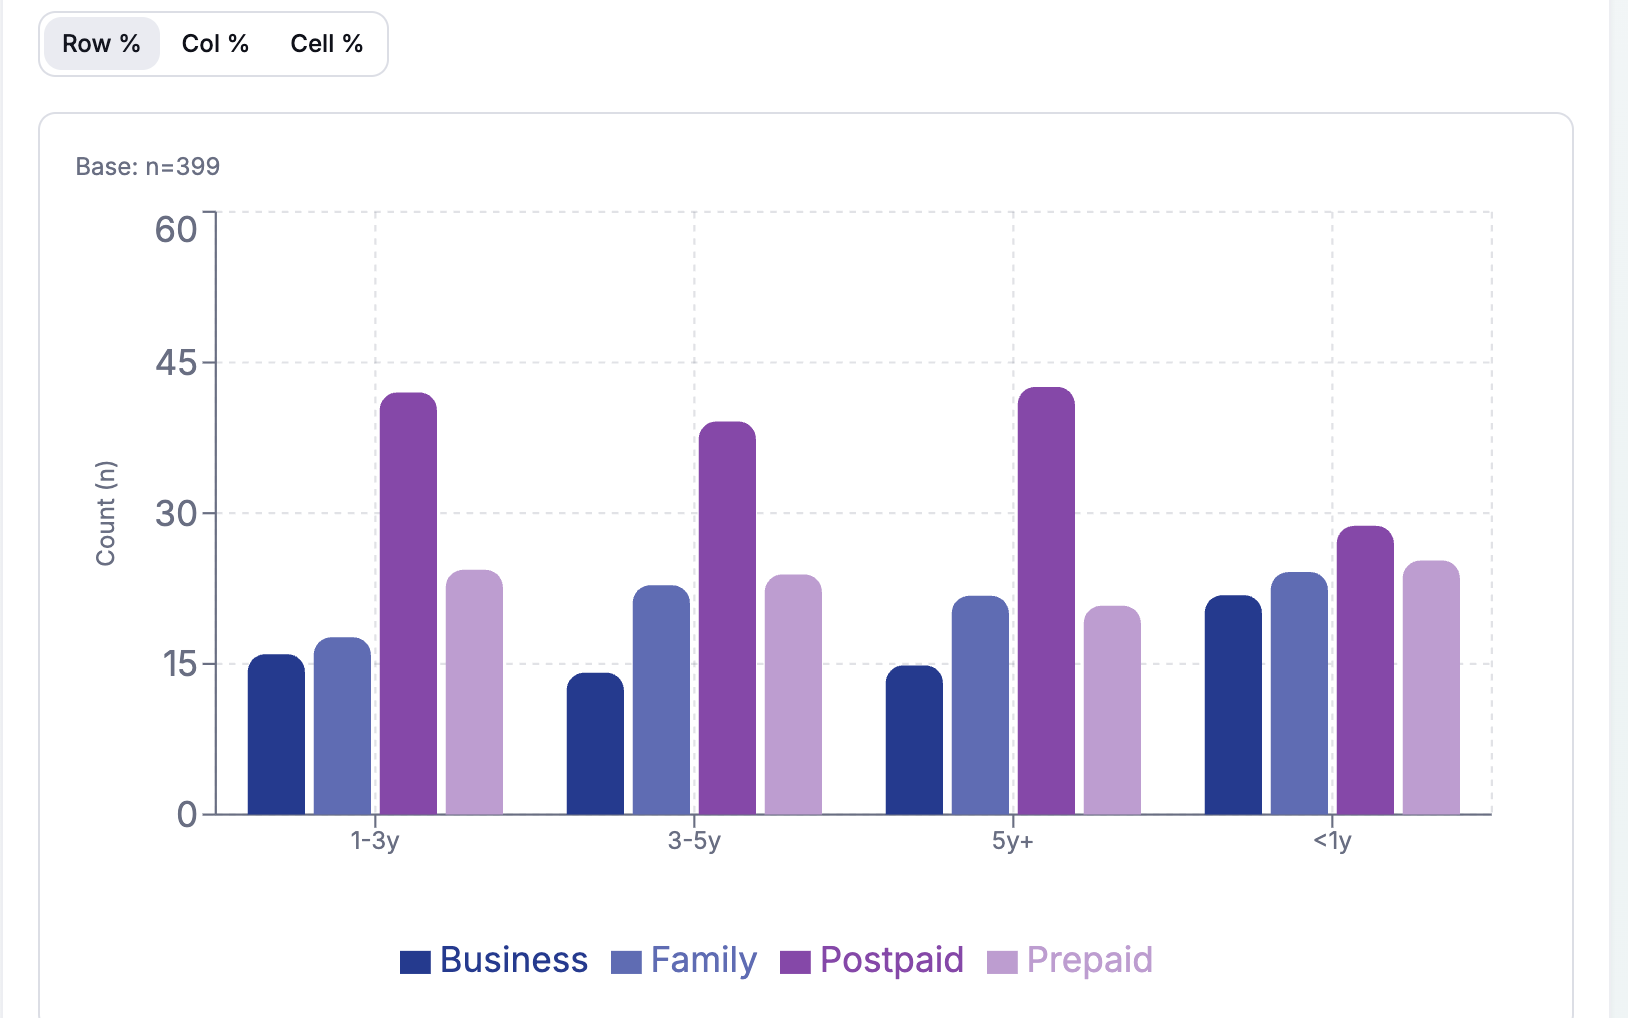
| NPS Bucket | Total | Segment A | Segment B |
|---|---|---|---|
| n=399 | n=240 | n=159 | |
| Promoters | 46% | 51%B | 38% |
| Passives | 26% | 22% | 33%A |
| Detractors | 28% | 27% | 29% |
| NPS | +18 | +24 | +9 |
A superscript marks a result significantly higher than the segment it names, at 95%. Total is shown for reference and is not tested.
2.3 · Analyse with AI
Open-end coding & text analysis
Open-ends, finally handled end to end, without the week of manual coding. Themes and code-frame labels follow your house naming conventions, and every code traces back to the verbatims behind it.
- Auto-theme discovery with an editable code frame in your naming conventions
- Merge, split, rename and re-code with one click, with no re-run required
- Click any theme to read the verbatims and sentiment behind it
open_ends.themes
- Network reliability23% · n=142
- Support wait times16% · n=98
- Billing & hidden fees12% · n=76
- App & portal usability9% · n=54
Top 4 of 11 themes · base 612 verbatims coded. Click any theme to read the verbatims behind it.
Brand & export
Bind to your brand and export native, editable decks. Unmistakably yours, every time.
3.1 · Brand & export
V²AID™ · your house DNA
V²AID is our proprietary house DNA profile. It holds your voice, your visual system and the calls your team makes by default, which is why every surface the platform produces resolves to your team rather than a platform default.
- Your house style on every surface: deck, portal, exports, chat
- Held consistent across teams, waves and projects
- Pre-publish brand pass before anything reaches a client or stakeholder (roadmap)
agency_dna.profile
one profile · every surface
3.2 · Brand & export
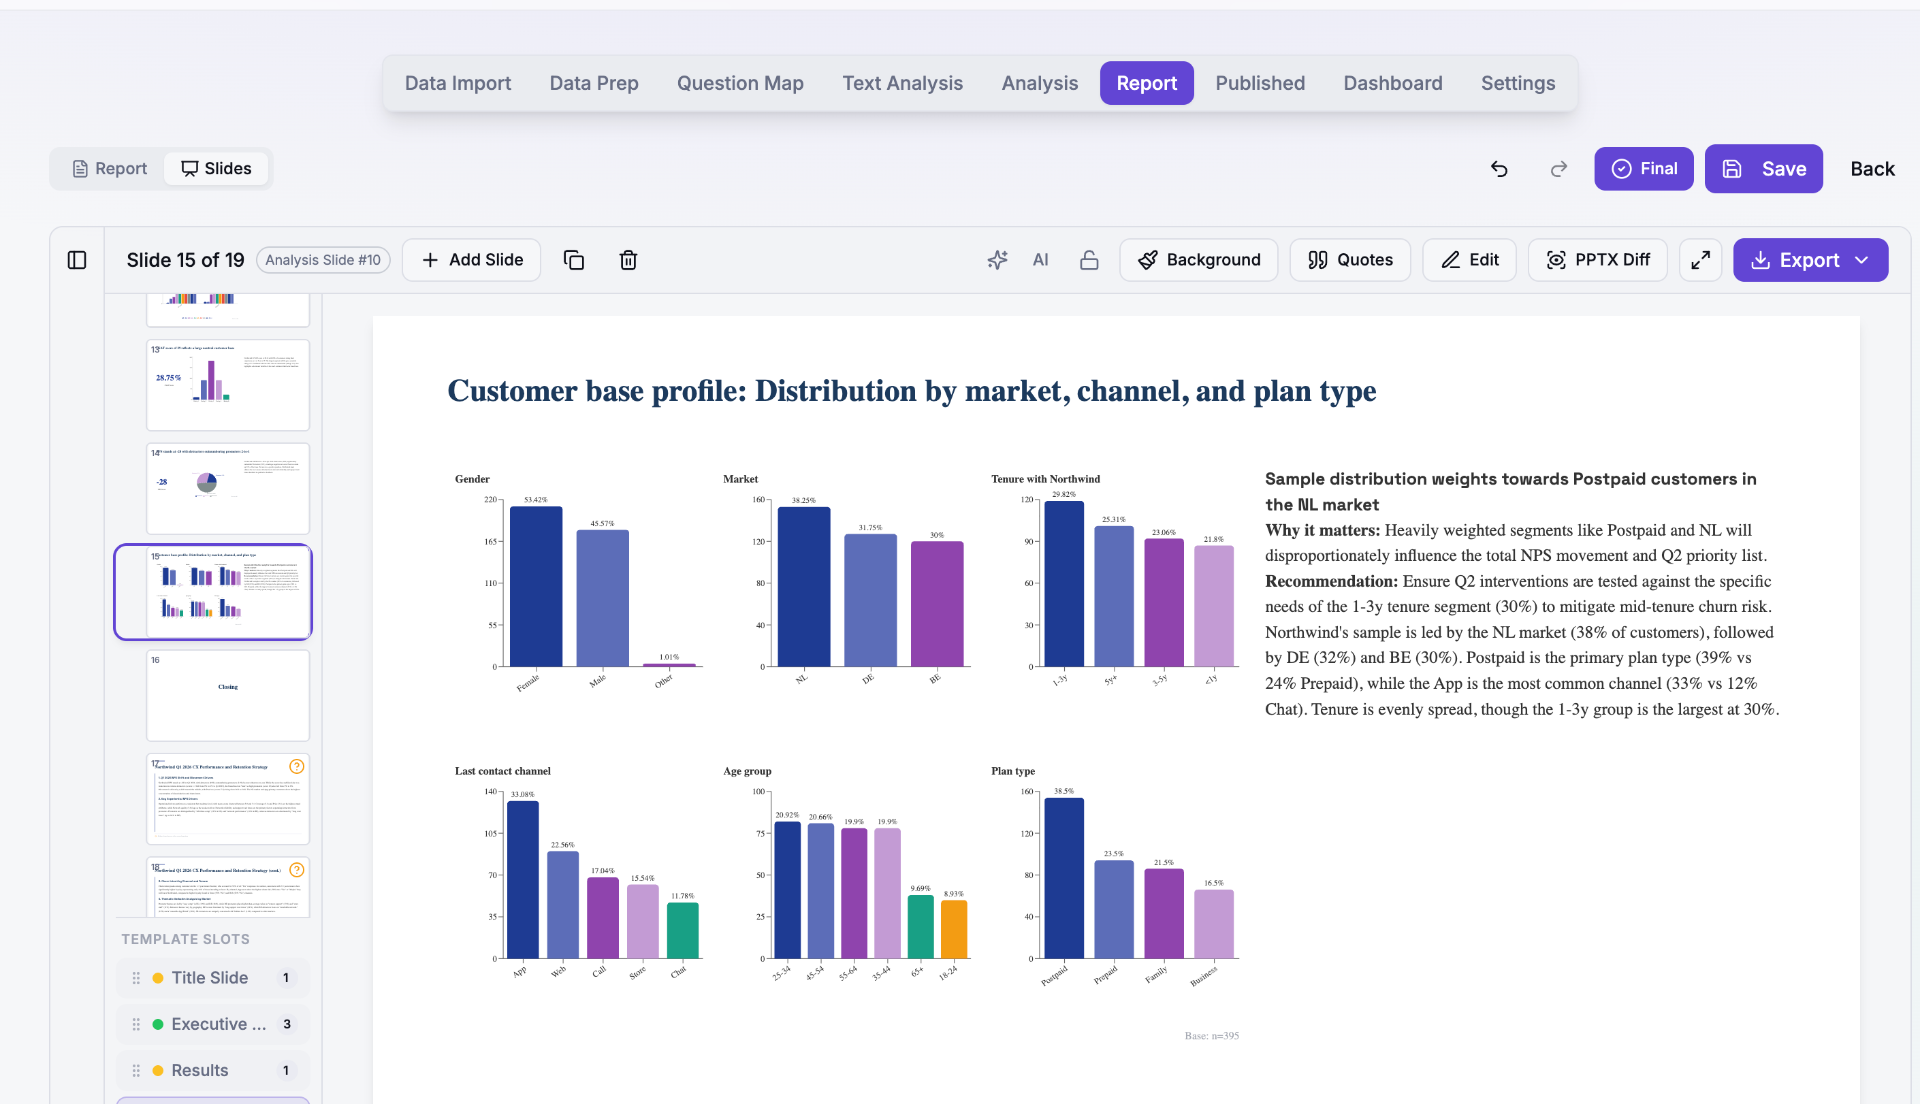
Bring your own PowerPoint
Drop in your branded .pptx and every export inherits your house style, automatically.
- Per-client template library
- House style applied end-to-end
brand_kit.pptx
Aa
Display · Fraunces
Aa
Body · Inter
3.3 · Brand & export
Native PPTX export
Editable native charts, not screenshots. Board-ready, with narrative flowing across slides the way an analyst would lay it out.
- Editable native chart objects
- Brand-bound colours, fonts, logos
export_preview.pptx
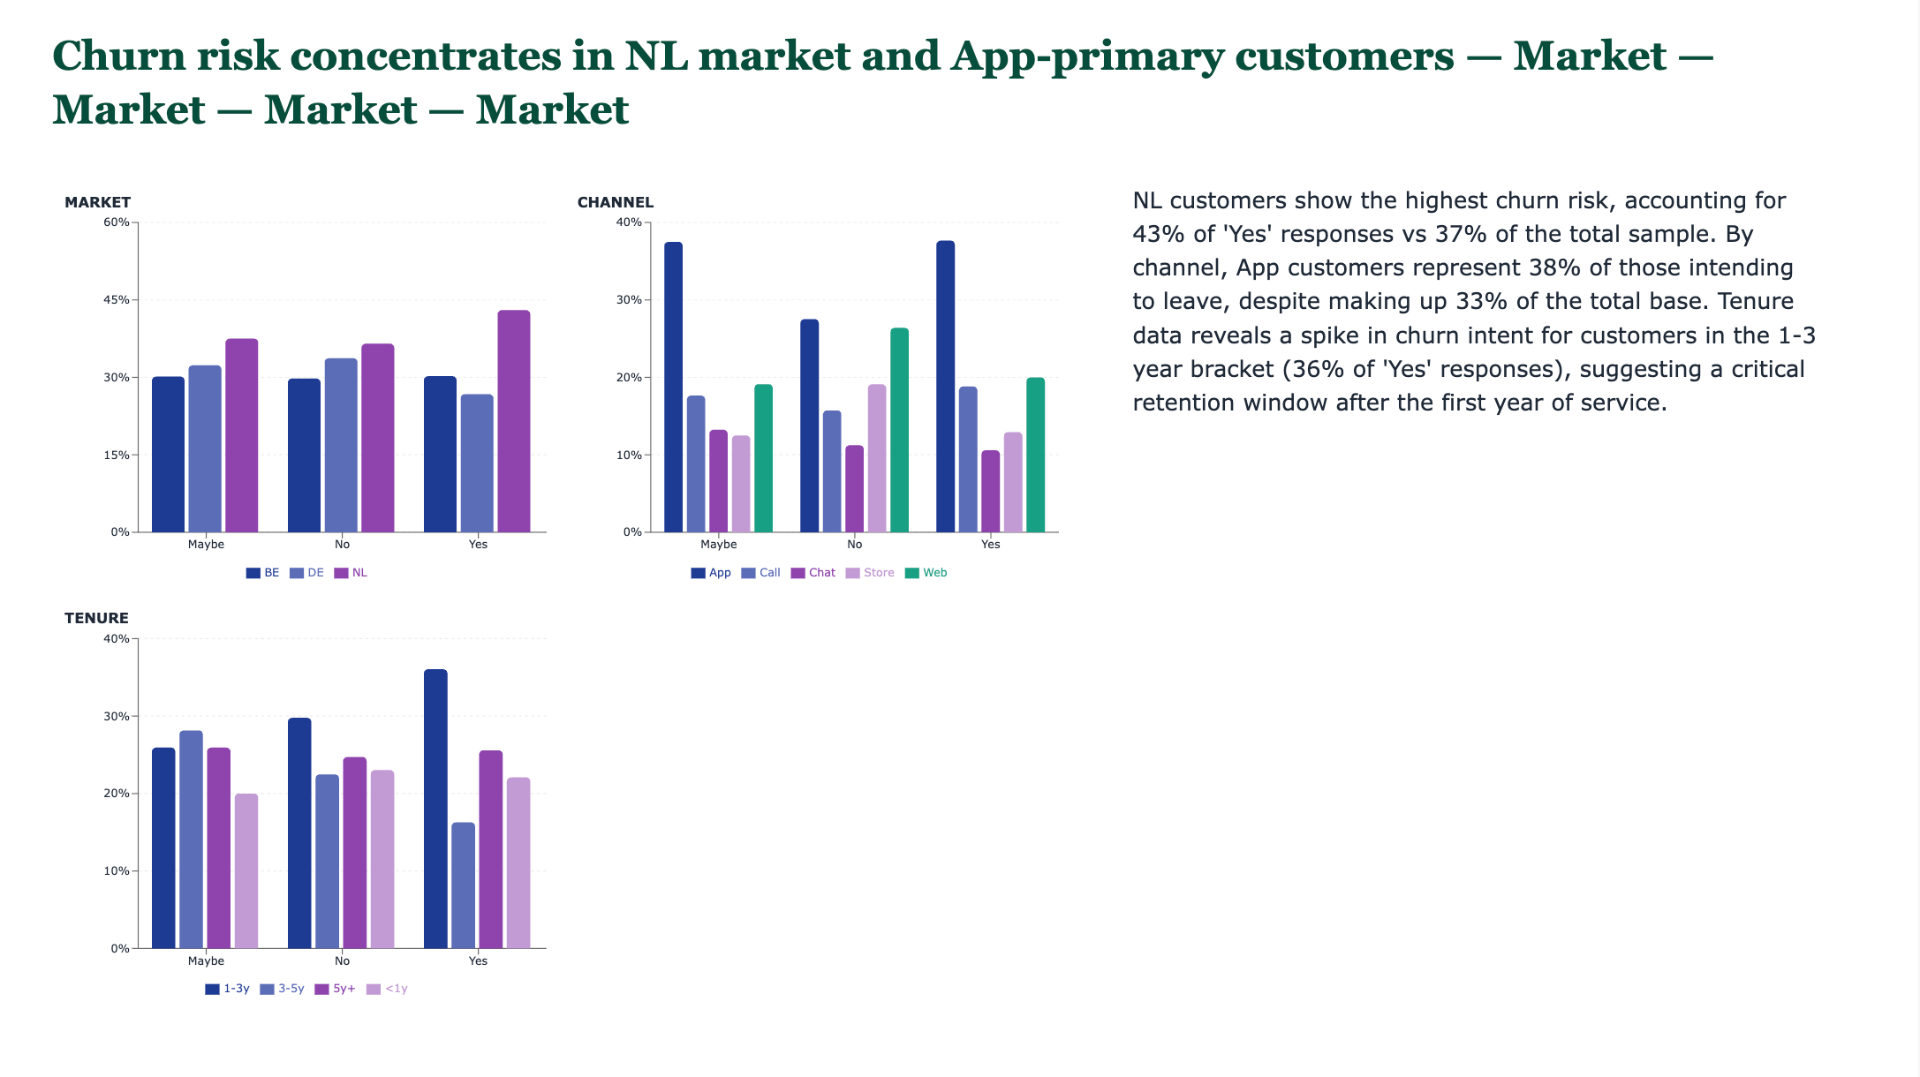
Section 04 · Churn risk
NL carries the highest churn risk of the three markets.
Source · northwind_q1_2026 · n=399
↳ editable native chart
Interrogate the report
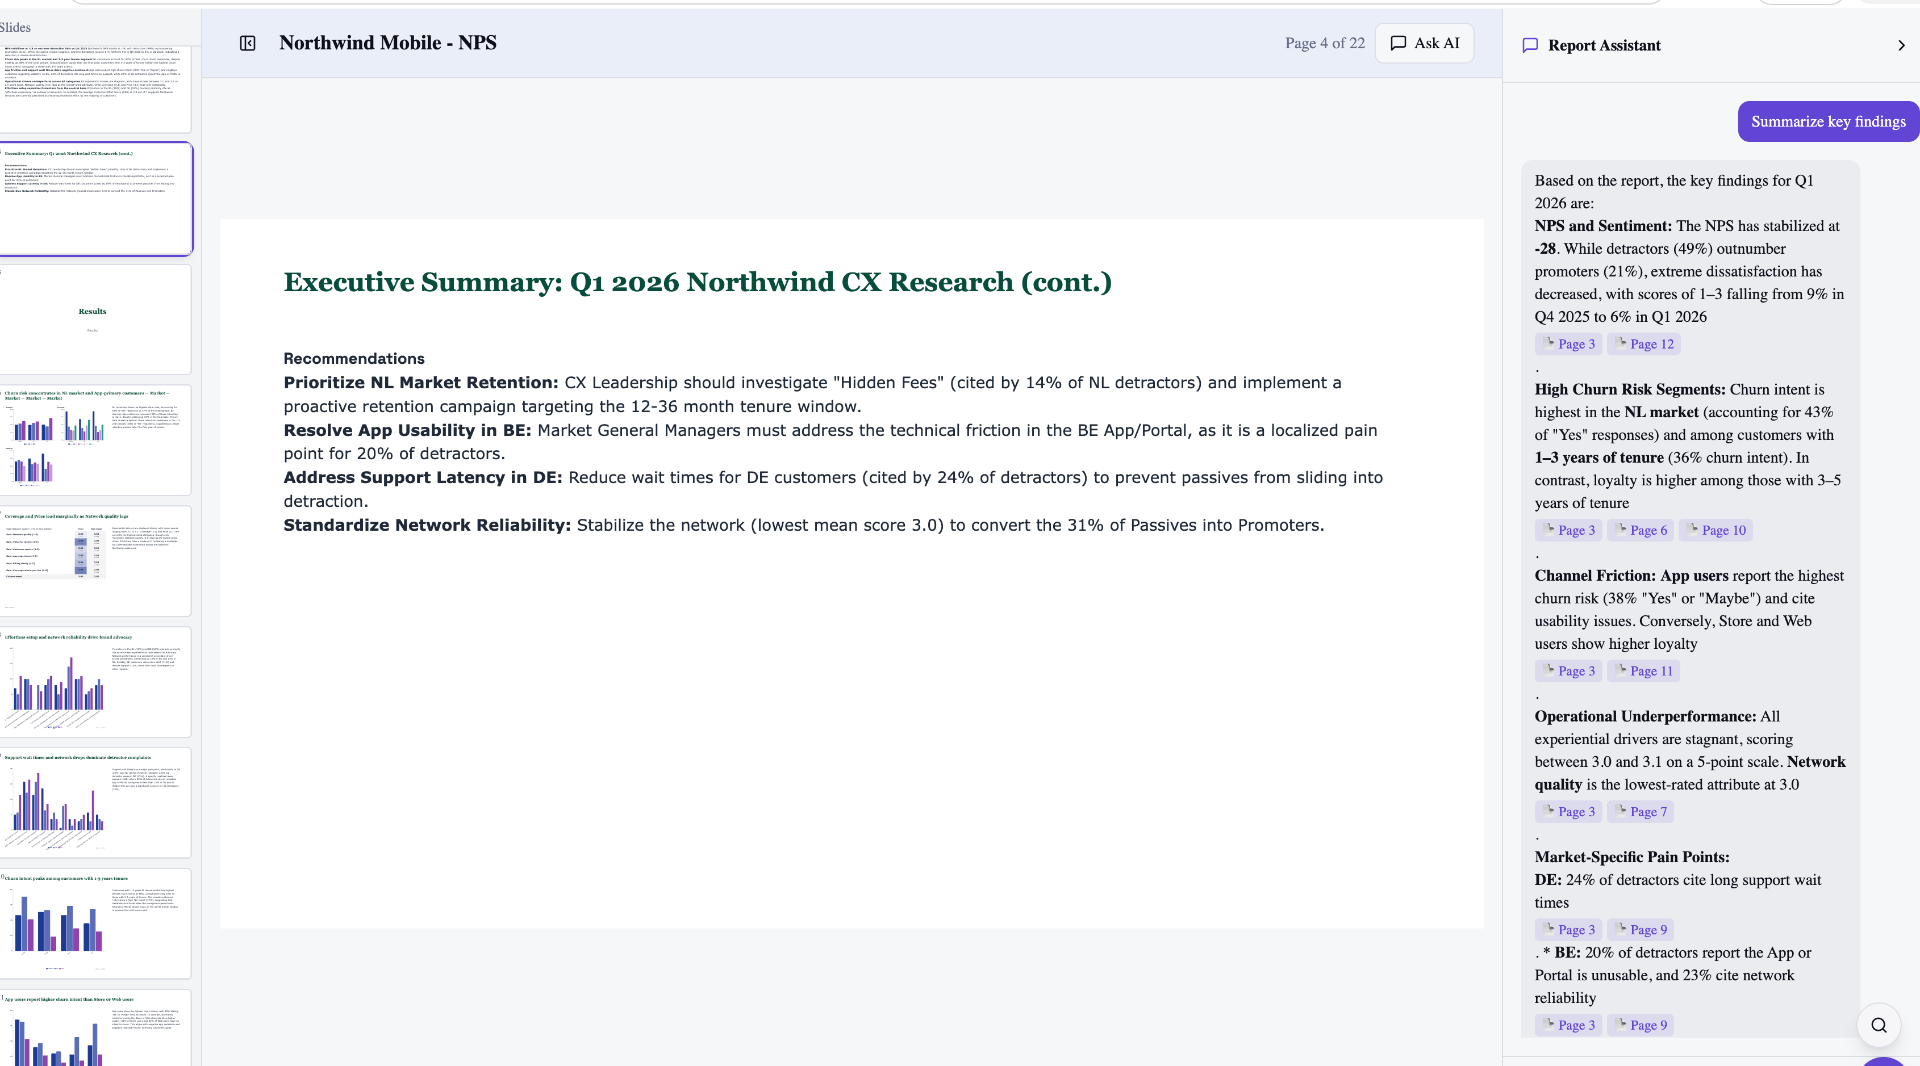
Once the deck ships, the evidence stays queryable. Stakeholders open the same portal you presented from and pull answers themselves, each one anchored to the exact cell, weight and verbatim it came from rather than a paraphrase.
4.1 · Interrogate the report
Live dashboards & client portals
A living portal per project, with magic-link access and per-slide read analytics. Filter and drill without exporting a new file every time a stakeholder has a question.
- Magic-link client portals
- Slide-level read & dwell analytics
- Filter & drill-down for stakeholders
- Versioned snapshots over time
client_portal.aa
Automate the report
One click takes a project from clean data to a branded deck, a live portal and a chat copilot. Analysts steer and sign off; nobody starts from a blank canvas.
5.1 · Automate the report
One-click first report
Report automation takes a project from clean data to a branded PPTX, a live portal and a chat copilot, unattended. The workbench auto-plans the analysis, runs the stats on tested code, codes the open-ends, drafts the narrative and binds it to your PowerPoint template. Analysts steer and edit; they don't build from a blank canvas.
- First deck in hours, not weeks, measured on the first project rather than the tenth
- Auto-plan · auto-analysis · auto-coding · auto-narrative · auto-brand
- Every number still cell-traceable back to the computation that produced it
- Researcher-in-the-loop on every step, so nothing ships without a review
- Reusable workflows and scheduled re-runs (rolling out)
first_report.run
elapsed · 02h 41m · unattended
The methods your team already asks for, named rather than hidden.
Every technique below runs on a versioned statistical engine, with the computation, arguments and weights recorded next to the result.
Tabulation
- Cross-tabs
- Banners
- Nets & top/bottom box
- Weighted bases
Board-ready tables with letter-notation significance, out of the box.
Statistical testing
- Chi-square
- Z/T tests
- ANOVA
- Sig-letter notation
Every test declared: design, weights, α, family-wise correction.
Weighting & sampling
- Rim / rake weighting
- Design weights
- Efficient bases
Survey design applied consistently across every table in the deck.
Experience KPIs
- NPS
- CSAT / CES
The standard KPIs, defined once and reused across waves and markets.
Drivers & segmentation (rolling out)
- Key driver regression
- Shapley / relative importance
- K-means & latent-class segmentation
- Segment profilers
Explain the number, then find the audiences that move it.
Choice & preference (rolling out)
- MaxDiff
- Conjoint (CBC)
- TURF
- Correspondence analysis
Techniques buyers ask about by name, supported without a specialist analyst on call.
Text & open-ends
- Auto theme discovery
- Code frame editor
- Sentiment
- Verbatim drill-down
Themes and labels follow your house naming conventions, auditable back to each verbatim.
Trackers & waves (rolling out)
- Wave-on-wave delta
- Significance vs prior wave
- Rolling bases
- Snapshot versioning
Set the analysis once and every wave inherits it.
Report automation
- One-click first report
- Auto-narrative in your voice
- Markets side by side in one report
- Multi-market fan-out (rolling out)
- Structured the way your team reports
- Snapshot diff (rolling out)
From clean data to branded deck and live portal, unattended, on the first run and every re-run.
Integrations
Plugs into the stack your team already runs.
Connect your fieldwork, file formats, brand templates and delivery channels, so evidence flows from response to deck without a single CSV detour.
Survey platforms
Rolling outQualtrics · Forsta · Alchemer · SurveyMonkey · Typeform · Jotform
Data files
SPSS .sav · CSV · Excel · multi-file merge with metadata
PowerPoint
Bring your branded .pptx and every export inherits your house style
Client portals
Magic-link delivery with slide-level read analytics
API & webhooks
Rolling outREST endpoints and event hooks for custom pipelines
Identity & SSO
Email and password sign-in today; Google Workspace, SAML and Microsoft Entra rolling out for Enterprise
Want to see this on your dataset?
We'll walk through the three acts live, end to end, in 30 minutes.